Urbanie & Urbanus

Issue 2022 Dec
Resilient cities
Issue 7, P.55 - P.89
Accessibility to Hong Kong urban waterfront Is it fostering resilient communities?
Figures

Figure 1 Study theoretical framework.

Figure 2 Hong Kong, urban core waterfront functional zones (Source: HKSAR Harbourfront Commission)

Figure 3 monthly visits to different open space type within walking distance from home (Source: Lai, 2018)

Figure 4 Aerial view of the three-case study areas. (Source: Google aerial, 2022)

Figure 5 Usage Frequency of Seafront or Riverfront Promenades by district; Source: (Lai, 2018)

Figure 6 Satisfaction with the quantity of Open Space by districts (Source: Lai, 2018)

Figure 7 Project Area Inventory 2022. Source: LandsD 2022.
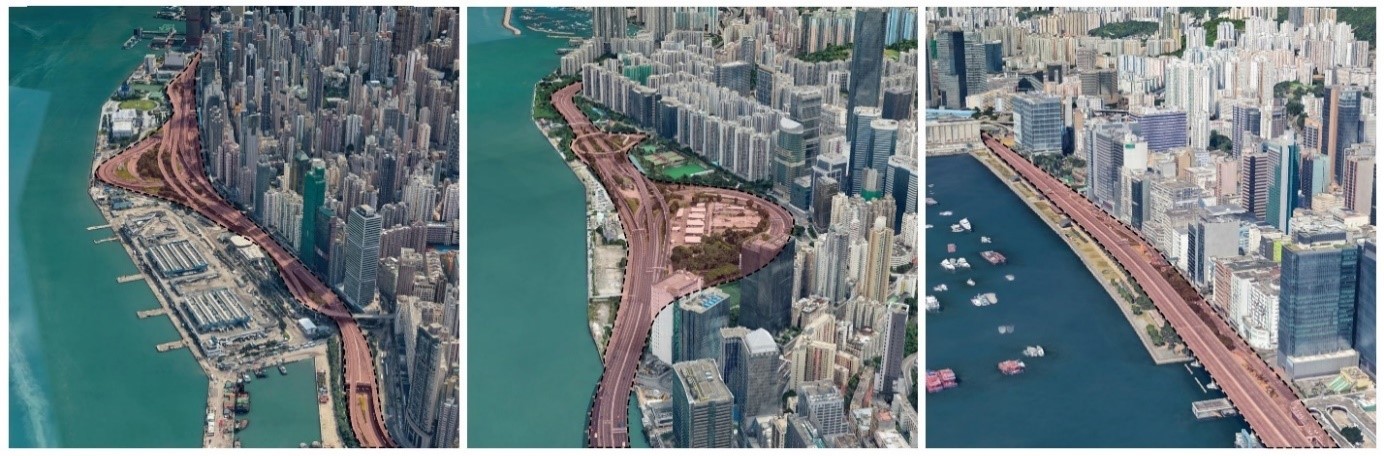
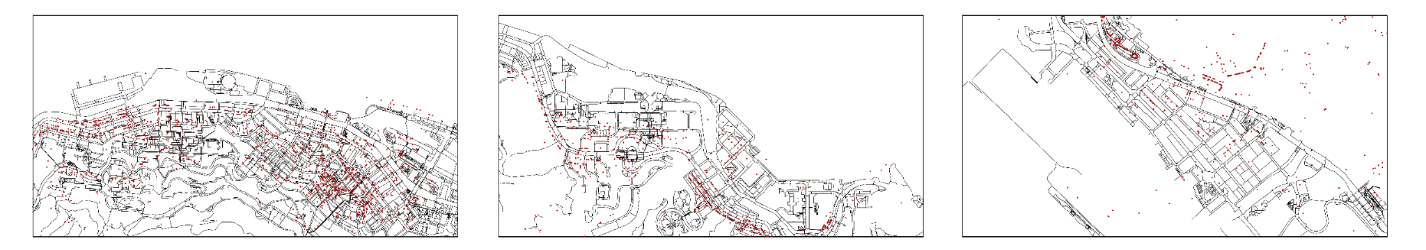
Figure 8 Sheung Wan; Quarry Bay; Kwun Tong Waterfront promenade street layout and aerial views.(Source: LandsD and Google aerial 2022)


Figure 8 Sheung Wan; Quarry Bay; Kwun Tong Waterfront promenade street layout and aerial views.(Source: LandsD and Google aerial 2022)


Figure 10 Aerial view of Quarry Bay waterfront promenade (Source: Google view)


Figure 11 The view standing on Kwun Tong waterfront promenade (Source: Google view)

Figure 12 Case Studies: Existing Metro Line and MTR stations.

Figure 13 Kwun Tong Waterfront Area - Park and green open space

Figure 14 Sheung Wan Waterfront Area - Park and green open space

Figure 15 Quarry Bay Waterfront Area - Park and green open space

Figure 16 Sheung Wan OZP (Source: OZP, HKSAR, 2022, https://www2.ozp.tpb.gov.hk)

Figure 17 Quarry Bay OZP

Figure 19: Kwun Tong OZP

Figure 20 Sheung Wan Waterfront Promenade access point – MTR egress

Figure 21 Quarry Bay Waterfront Promenade access point – MTR egress

Figure 22 Kwun Tong Waterfront Promenade access point – MTR egress

Figure 23 Sheung Wan network betweenness within 150m

Figure 24 Sheung Wan network betweenness within 300m

Figure 25 Sheung Wan network betweenness within 450m

Figure 26 Sheung Wan Buildings 150m around the waterfront entrance

Figure 27 Sheung Wan Building 300m around the waterfront entrance

Figure 28 Sheung Wan Building 450m around the waterfront entrance

Figure 29 Sheung Wan POI 150m around the waterfront entrance

Figure 30 Sheung Wan POI 300m around the waterfront entrance

Figure 31 Sheung Wan POI 450m around the waterfront entrance

Figure 32 Quarry Bay Waterfront Area Betweenness within 150m

Figure 33 Quarry Bay Waterfront Area Betweenness within 300m

Figure 34 Quarry Bay Waterfront Area Betweenness within 450m

Figure 35 Quarry Bay Buildings 150m around the waterfront entrance

Figure 36 Quarry Bay Buildings 300m around the waterfront entrance

Figure 37 Quarry Bay Buildings 450m around the waterfront entrance

Figure 38 Quarry Bay POI 150m around the waterfront entrance

Figure 39 Quarry Bay POI 300m around the waterfront entrance

Figure 40 Quarry Bay POI 450m around the waterfront entrance

Figure 41 Kwun Tong Waterfront Area Betweenness within 150m

Figure 42 Kwun Tong Waterfront Area Betweenness within 300m

Figure 43 Kwun Tong Waterfront Area Betweenness within 450m

Figure 44 Kwun Tong Buildings 150m around the waterfront entrance

Figure 45 Kwun Tong Buildings 300m around the waterfront entrance

Figure 46 Kwun Tong Buildings 450m around the waterfront entrance

Figure 47 Kwun Tong POI 150m around the waterfront entrance

Figure 48 Kwun Tong POI 300m around the waterfront entrance

Figure 49 Kwun Tong POI 450m around the waterfront entrance

Table 1 Urban vitality proxies

Table 2 Input datasets required for the study

Table 3 Accessibility configuration measures

Table 4 Criteria related to the built environment and infrastructure [adapted from Sharifi (2016)]

Table 5 Ranking of POS accessibility for each district. (Source: Lai, 2018).